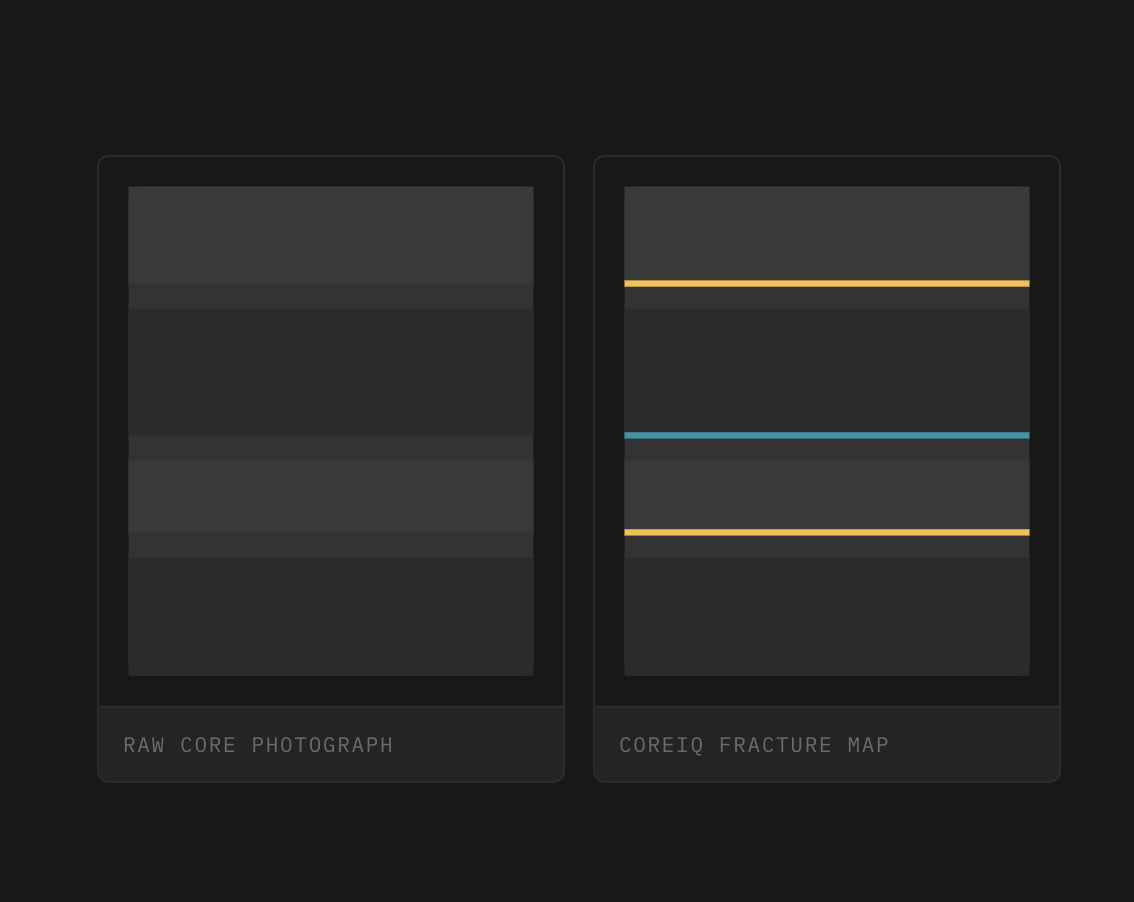
CoreIQ turns photographs of your drill core into standardized RQD — automatically separating natural fractures from breaks caused by drilling and handling, with every value traceable back to its source photo.
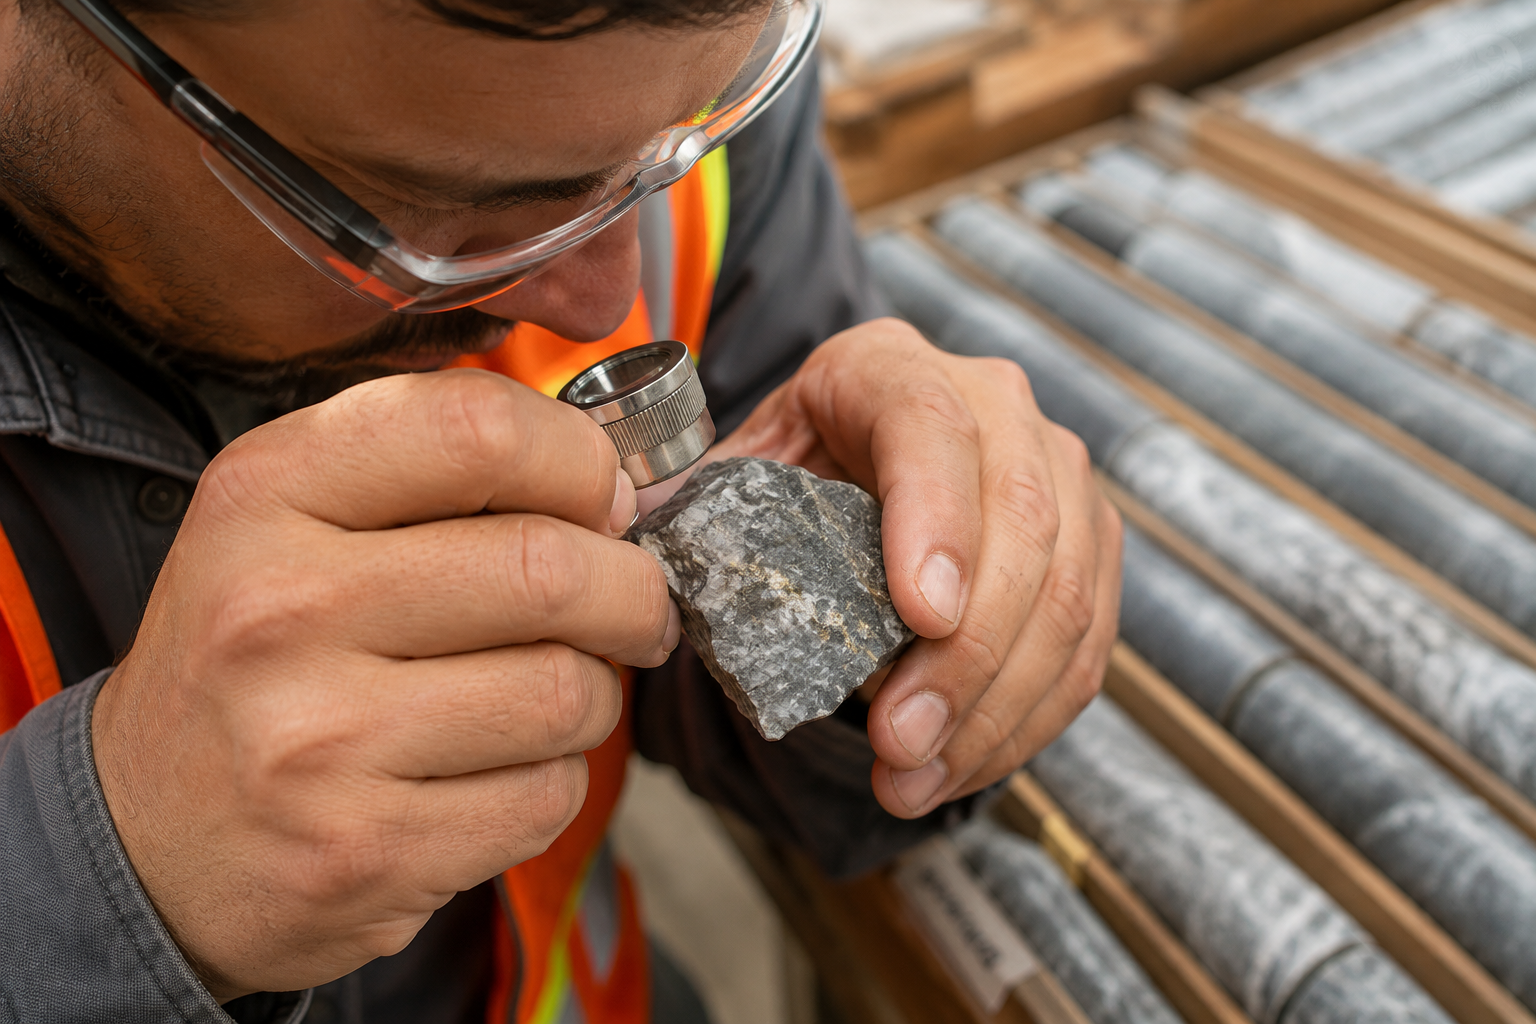
From RQD to fracture characterization and other rock mass observations, traditional core logging relies on manual interpretation. Differences in experience, fatigue, and logging practices can introduce variability that makes historical datasets difficult to compare and validate.
Re-processing years of core is rarely feasible, and in many cases the original material is no longer available.
CoreIQ transforms existing core photography into standardized, traceable geotechnical data—automating measurements, reducing variability, and preserving a direct link to every source image.
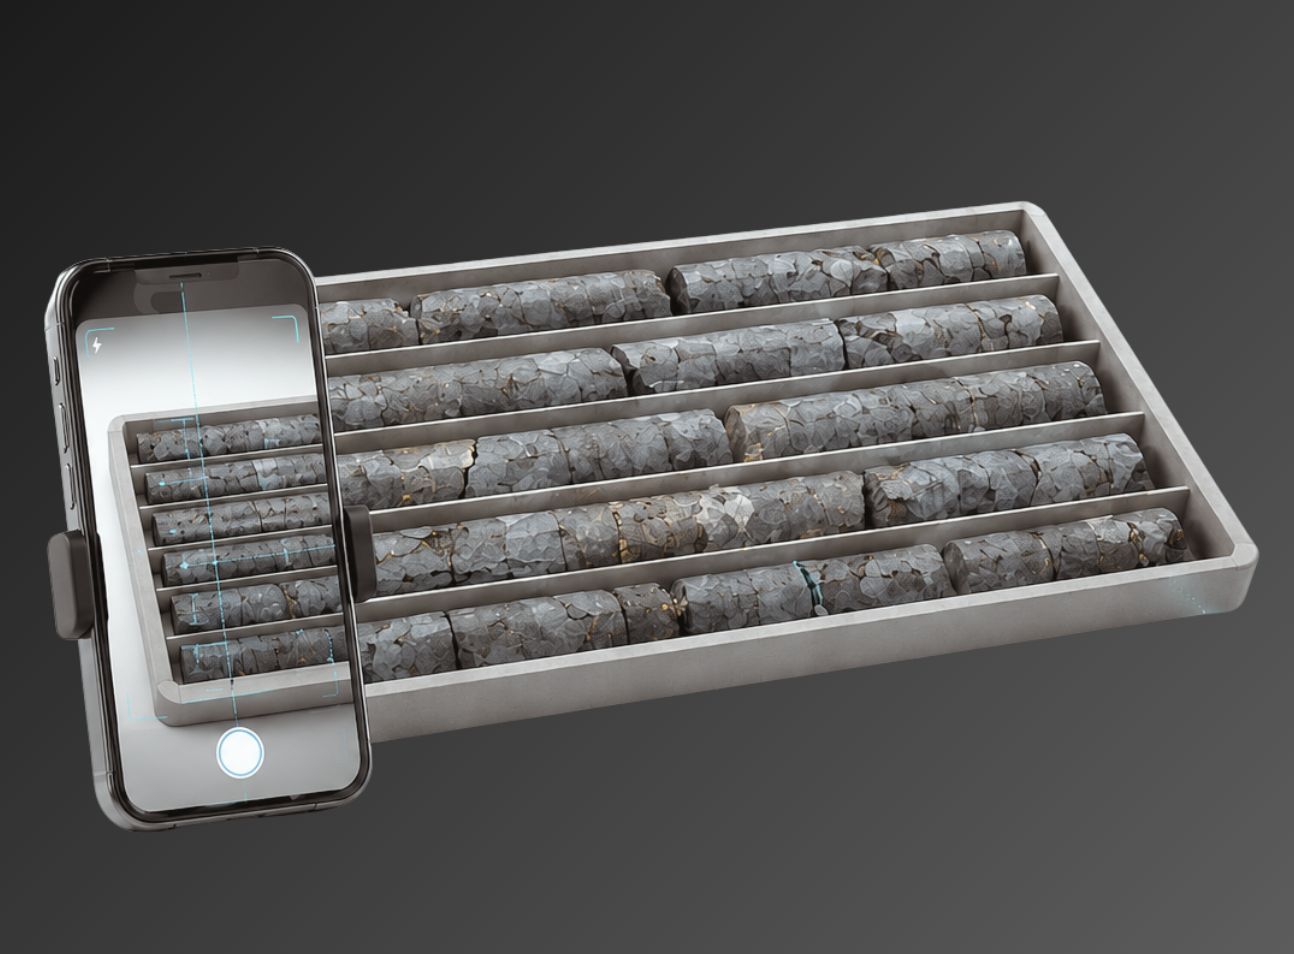
Upload core box photographs the way your team already captures them—at the rig, in the logging facility, or from your historical archive. No specialized equipment or changes to your existing workflow are required.
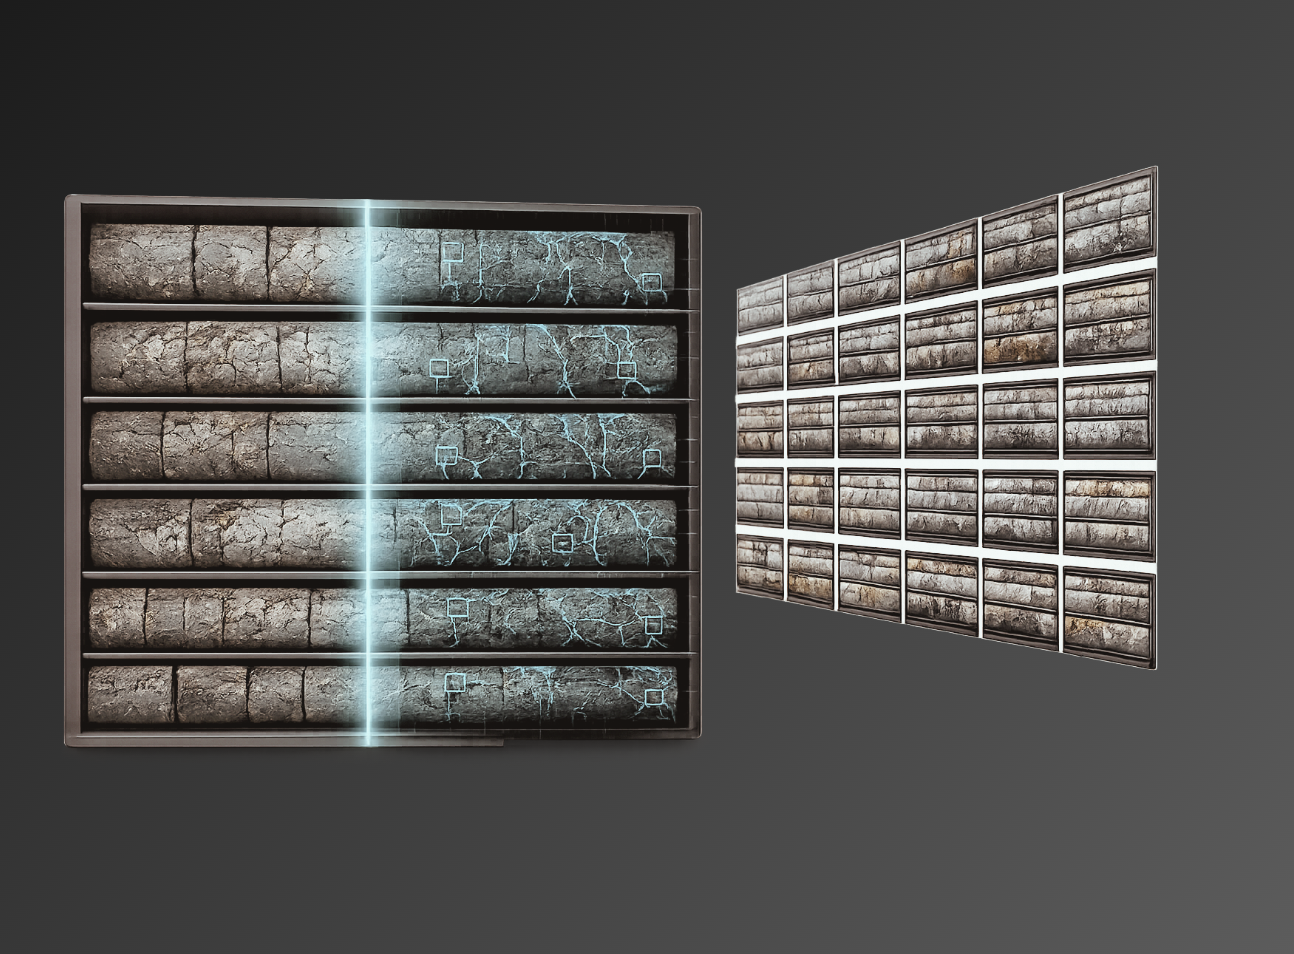
CoreIQ automatically analyzes core images to identify geological and geotechnical features, generating standardized, image-based outputs—including RQD and other measurements—using a consistent, repeatable methodology.
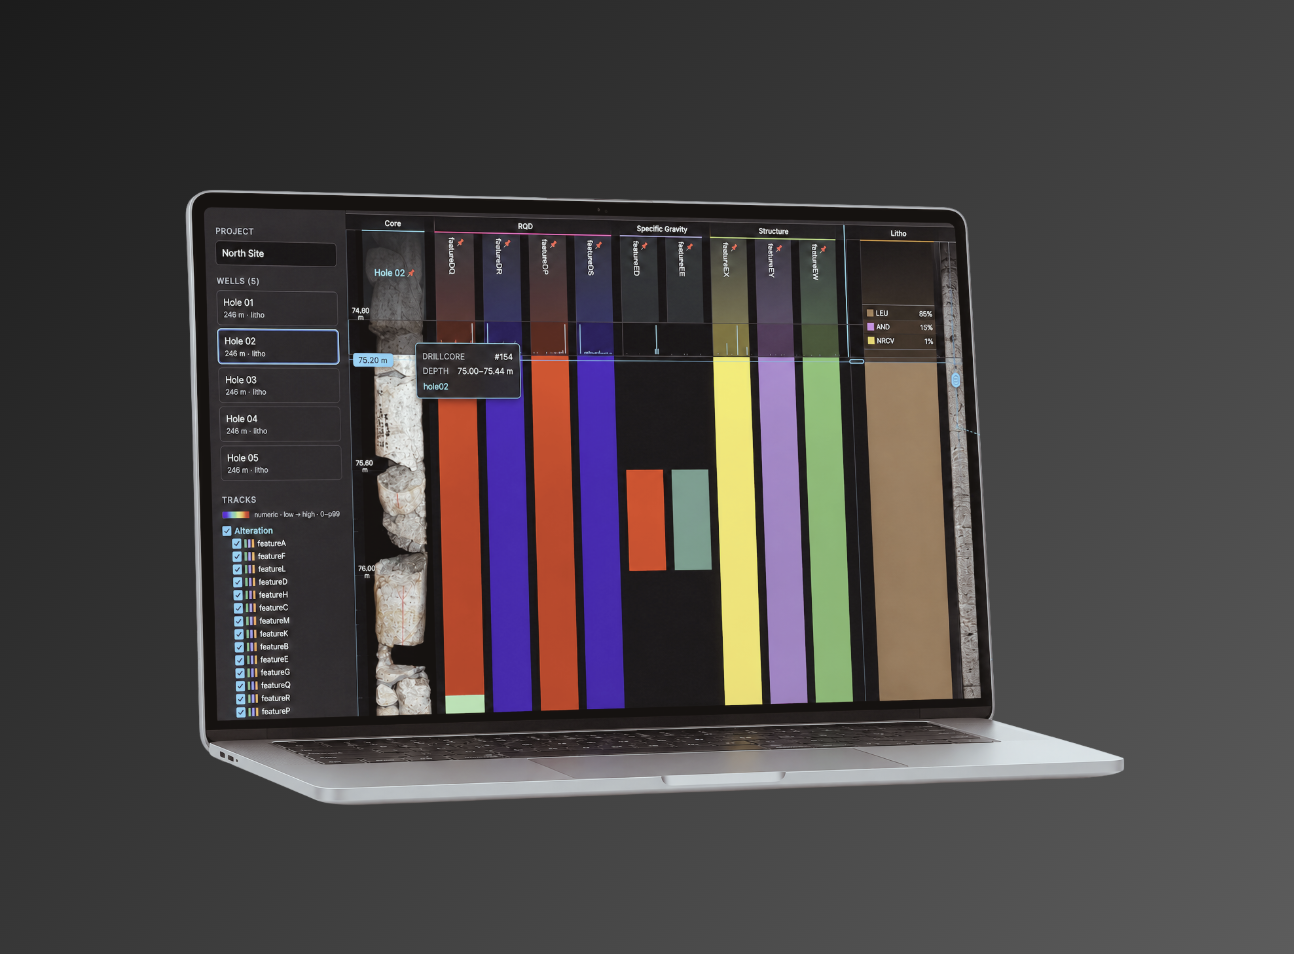
Every result remains linked to the original photograph, making outputs fully traceable and easy to validate. Review predictions in context alongside lithology, alteration, grade, and other geological datasets within the visualizer.
CoreIQ's visualizer brings RQD together with lithology, mineral grade, alteration, and geotechnical parameters in a single interactive model — built from the same core photographs your team already logs.
Based on an active application case, CoreIQ's fracture model marks every detected break directly on the core photograph and classifies it as natural or mechanically induced — so your geotechnical team can review and validate against the same evidence the model used.
A short walkthrough of the platform — from photograph to fracture classification to the visualizer.
"CoreIQ doesn't replace geotechnical judgment—it applies the same consistent criteria to every core, helping you uncover hidden value already stored in your historical datasets."
Explore how CoreIQ can help your team generate consistent, traceable geotechnical insights from existing core photography.

.png)